In order to apply ABC to Plastim’s costing system, we follow the seven-step approach to costing and the three guidelines for refining costing systems (increasing direct-cost tracing, creating homogeneous indirect-cost pools, and identifying cost-allocation bases that have cause-and-effect relationships with costs in the cost pool). Exhibit 5-3 shows an overview of Plastim’s ABC system. Use this exhibit as a guide as you study the following steps, each of which is marked in Exhibit 5-3.
Step 1: Identify the Products That Are the Chosen Cost Objects. The cost objects are the 60,000 S3 and the 15,000 CL5 lenses that Plastim will produce in 2011. Plastim’s goal is to first calculate the total costs and then the per-unit cost of designing, manufacturing, and distributing these lenses. Step 2: Identify the Direct Costs of the Products. Plastim identifies as direct costs of the lenses: direct material costs, direct manufacturing labor costs, and mold cleaning and maintenance costs because these costs can be economically traced to a specific lens or mold. Exhibit 5-5 shows the direct and indirect costs for the S3 and CL5 lenses using the ABC system. The direct costs calculations appear on lines 6, 7, 8, and 9 of Exhibit 5-5. Plastim classifies all other costs as indirect costs, as we will see in Exhibit 5-4. Step 3: Select the Activities and Cost-Allocation Bases to Use for Allocating Indirect Costs to the Products. Following guidelines 2 and 3 for refining a costing system, Plastim identifies six activities—(a) design, (b) molding machine setups, (c) machine operations, (d) shipment setup, (e) distribution, and (f) administration—for allocating indirect costs to products. Exhibit 5-4, column 2, shows the cost hierarchy category, and column 4
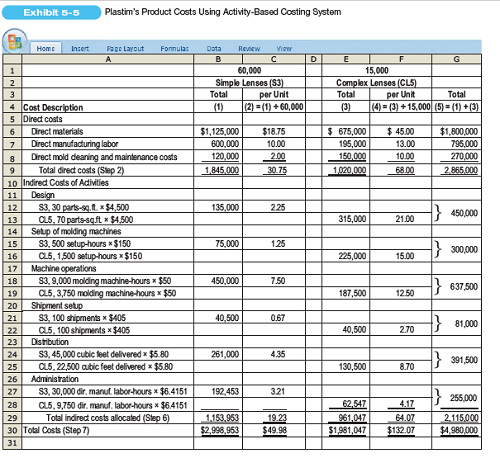
Step 1: Identify the Products That Are the Chosen Cost Objects. The cost objects are the 60,000 S3 and the 15,000 CL5 lenses that Plastim will produce in 2011. Plastim’s goal is to first calculate the total costs and then the per-unit cost of designing, manufacturing, and distributing these lenses. Step 2: Identify the Direct Costs of the Products. Plastim identifies as direct costs of the lenses: direct material costs, direct manufacturing labor costs, and mold cleaning and maintenance costs because these costs can be economically traced to a specific lens or mold. Exhibit 5-5 shows the direct and indirect costs for the S3 and CL5 lenses using the ABC system. The direct costs calculations appear on lines 6, 7, 8, and 9 of Exhibit 5-5. Plastim classifies all other costs as indirect costs, as we will see in Exhibit 5-4. Step 3: Select the Activities and Cost-Allocation Bases to Use for Allocating Indirect Costs to the Products. Following guidelines 2 and 3 for refining a costing system, Plastim identifies six activities—(a) design, (b) molding machine setups, (c) machine operations, (d) shipment setup, (e) distribution, and (f) administration—for allocating indirect costs to products. Exhibit 5-4, column 2, shows the cost hierarchy category, and column 4


shows the cost-allocation base and the budgeted quantity of the cost-allocation base for each activity described in column 1. Identifying the cost-allocation bases defines the number of activity pools into which costs must be grouped in an ABC system. For example, rather than define the design activities of product design, process design, and prototyping as separate activities, Plastim defines these three activities together as a combined “design” activity and forms a homogeneous design cost pool. Why? Because the same cost driver, the complexity of the mold, drives costs of each design activity. A second consideration for choosing a cost-allocation base is the availability of reliable data and measures. For example, in its ABC system, Plastim measures mold complexity in terms of the number of parts in the mold and the surface area of the mold (parts-square feet). If these data are difficult to obtain or measure, Plastim may be forced to use some other measure of complexity, such as the amount of material flowing through the mold that may only be weakly related to the cost of the design activity.
Step 4: Identify the Indirect Costs Associated with Each Cost-Allocation Base. In this step, Plastim assigns budgeted indirect costs for 2011 to activities (see Exhibit 5-4, column 3), to the extent possible, on the basis of a cause-and-effect relationship between the cost-allocation base for an activity and the cost. For example, all costs that have a cause-and-effect relationship to cubic feet of packages moved are assigned to the distribution cost pool. Of course, th strength of the cause-and-effect relationship between the cost-allocation base and the cost ofan activity varies across cost pools. For example, the cause-and-effect relationship between direct manufacturing labor-hours and administration activity costs is not as strong as the relationship between setup-hours and setup activity costs.
Some costs can be directly identified with a particular activity. For example, cost of materials used when designing products, salaries paid to design engineers, and depreciation of equipment used in the design department are directly identified with the design activity. Other costs need to be allocated across activities. For example, on the basis of interviews or time records, manufacturing engineers and supervisors estimate the time they will spend on design, molding machine setup, and machine operations. The time to be spent on these activities serves as a basis for allocating each manufacturing engineer’s and supervisor’s salary
costs to various activities. Still other costs are allocated to activity-cost pools using allocation bases that measure how these costs support different activities. For example, rent costs are allocated to activity cost pools on the basis of square-feet area used by different activities. The point here is that all costs do not fit neatly into activity categories. Often, costs may first need to be allocated to activities (Stage 1 of the 2-stage cost-allocation model) before the costs of the activities can be allocated to products (Stage 2).
Step 5: Compute the Rate per Unit of Each Cost-Allocation Base. Exhibit 5-4, column 5, summarizes the calculation of the budgeted indirect cost rates using the budgeted quantity of the cost-allocation base from Step 3 and the total budgeted indirect costs of each activity from Step 4.
Step 6: Compute the Indirect Costs Allocated to the Products. Exhibit 5-5 shows total budgeted indirect costs of $1,153,953 allocated to the simple lens and $961,047 allocated to the complex lens. Follow the budgeted indirect cost calculations for each lens in Exhibit 5-5. For each activity, Plastim’s operations personnel indicate the total quantity of the cost-allocation base that will be used by each type of lens (recall that Plastim operates at capacity). For example, lines 15 and 16 of Exhibit 5-5 show that of the 2,000 total setup-hours, the S3 lens is budgeted to use 500 hours and the CL5 lens 1,500 hours. The budgeted indirect cost rate is $150 per setup-hour (Exhibit 5-4, column 5, line 5). Therefore, the total budgeted cost of the setup activity allocated to the S3 lens is $75,000 (500 setup-hours $150 per setup-hour) and to the CL5 lens is $225,000 (1,500 setuphours $150 per setup-hour). Budgeted setup cost per unit equals $1.25 ($75,000 ÷ 60,000 units) for the S3 lens and $15 ($225,000 ÷ 15,000 units) for the CL5 lens.
Step 7: Compute the Total Cost of the Products by Adding All Direct and Indirect Costs Assigned to the Products. Exhibit 5-5 presents the product costs for the simple and complex lenses. The direct costs are calculated in Step 2, and the indirect costs are calculated in Step 6. The ABC system overview in Exhibit 5-3 shows three direct-cost categories and six indirect-cost categories. The budgeted cost of each lens type in Exhibit 5-5 has nine line items, three for direct costs and six for indirect costs. The differences between the ABC product costs of S3 and CL5 calculated in Exhibit 5-5 highlight how each of these products uses different amounts of direct and indirect costs in each activity area. We emphasize two features of ABC systems. First, these systems identify all costs used by products, whether the costs are variable or fixed in the short run. When making long-run strategic decisions using ABC information, managers want revenues to exceed total costs. Second, recognizing the hierarchy of costs is critical when allocating costs to products. It is easiest to use the cost hierarchy to first calculate the total costs of each product. The per-unit costs can then be derived by dividing total costs by the number of units produced.
No comments:
Post a Comment